Developer Center
Overview
The Developer Center page lets your organization view and monitor your workspace's API activity in the Fireblocks Console.

The Overview tab lets you view a bar graph showing the distribution of your workspace's API requests. The default view is a seven-day distribution, but you can toggle it to view the last 24 hours of activity in one-hour windows.
Below the graph, you can view the category of each API request and what percentage that category makes up of the total distribution. Next to the percentage is the actual number of requests made within each category.
API monitoring
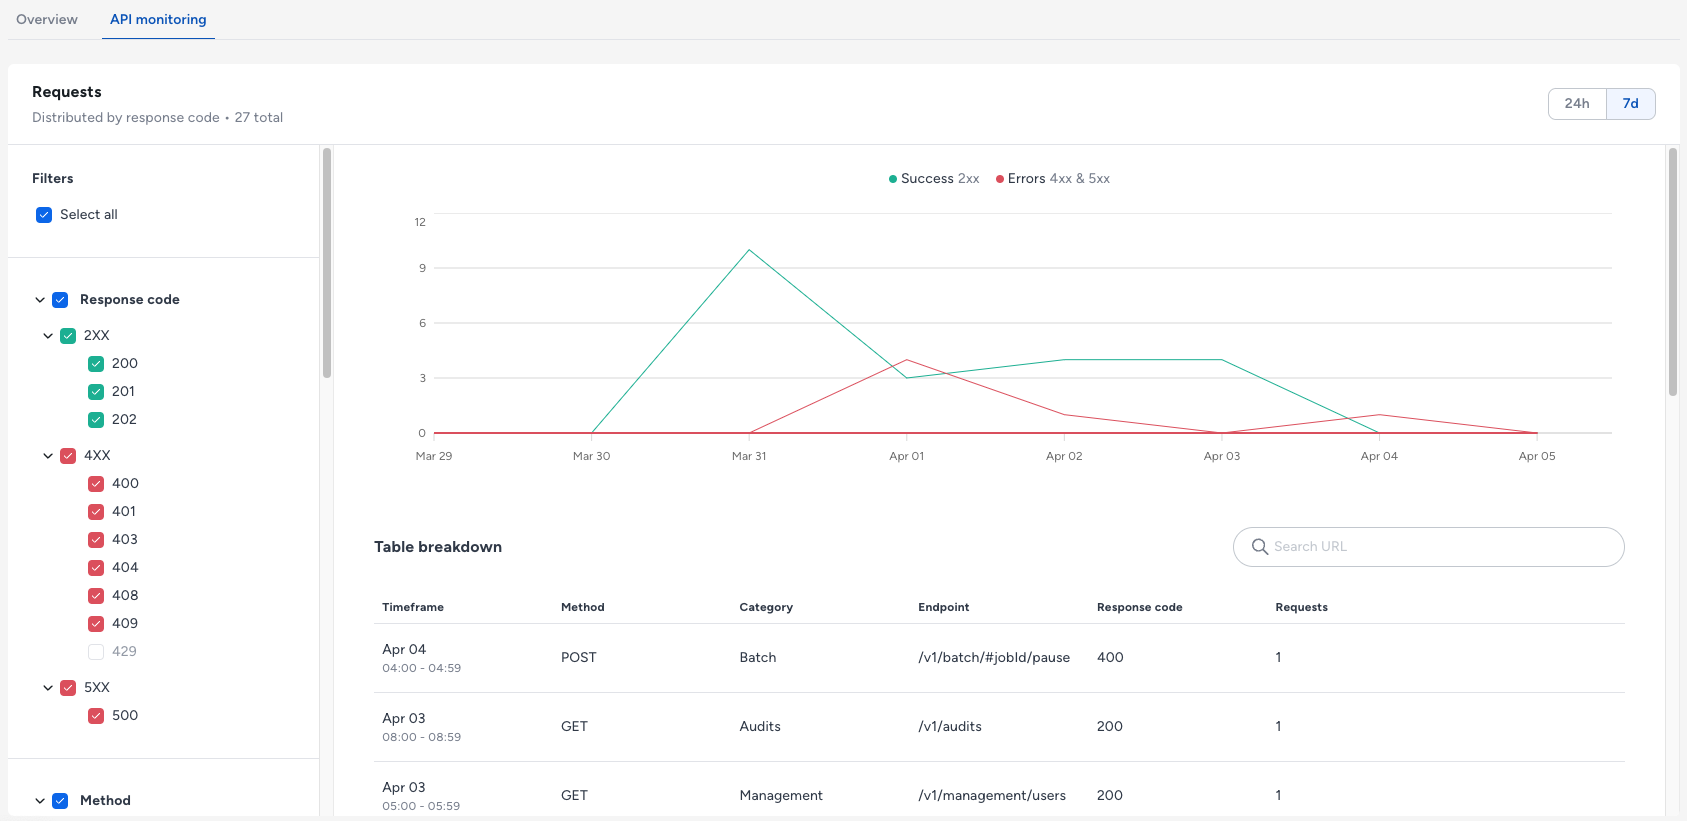
The API monitoring tab lets you view a line graph of the types of requests made over the last seven days. Like on the Overview tab, you can switch the view to a 24-hour format divided into one-hour windows.

Below the graph, a table shows a breakdown of each request by date and time, method, category, endpoint, response code, and the number of requests made. If your workspace has numerous requests, you can search the table using the search bar above it or filter the graph and the table using the Filters tree list on the left side of the page. You can filter by response code, method, and category.
Response code 429Response code 429, typically reserved for rate limited responses, is an upcoming feature that is not currently available to view or filter by.
API users
Only available to Admin-level workspace usersThe API users tab is only available to Admin-level workspace users such as the Owner, Admins, and Non-Signing Admins. The tab does not appear to any other user roles.
The API users tab lets you create and manage your workspace's API users. A table shows a list of the workspace's API users by name, role, API key, what user group (or groups) they're in, and their current status.

Visit our Help Center to learn more about:
- Adding API users
- Re-enrolling API users
- Deleting users (Owner only)
Updated 7 months ago